Who actually works in Korea — by nationality and age
Verified firsthand · Read the KOSIS tables DT_2FA003F, DT_2FA005F, DT_2FA006F and DT_2FC019R (Statistics Korea) and computed nothing that the tables did not already publish, on 2026-08-28
Of 1,692,000 foreign residents aged 15 or over, 1,109,000 are employed — an employment rate of 65.5%.
Split that by nationality and the range is enormous: from 94.6% down to 34.2%. It is tempting to read something into that about different nationalities. The tables argue for a much duller explanation, and the duller one is correct.
The short answer
| Foreign residents aged 15+ | 1,692,000 |
| Employed | 1,109,000 — 65.5% |
| Highest by nationality | Indonesia 94.6% |
| Lowest by nationality | Mongolia 34.2% |
| Highest by age | 30s, at 79.1% |
| Highest by education | middle school only, at 70.4% |
That last line is the tell. If education drove employment, it would not read like that.
By nationality
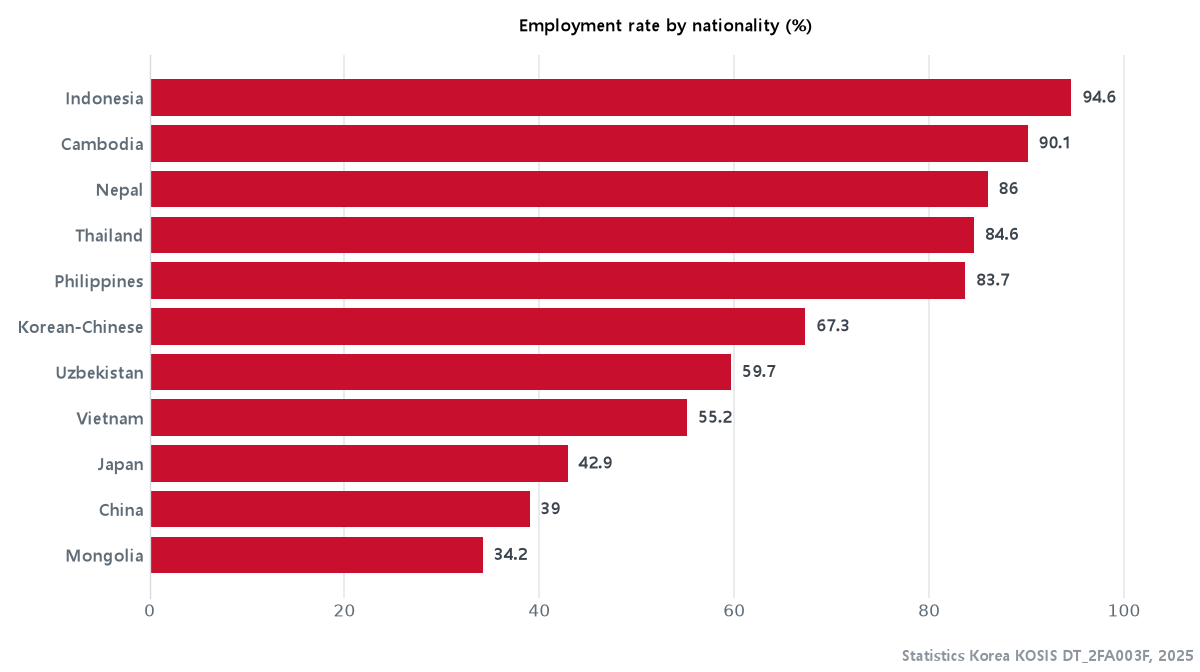
The countries at the top — Indonesia, Cambodia, Nepal, Thailand, the Philippines — are the countries Korea recruits from under the Employment Permit System, the scheme behind the E-9 visa. People arriving that way arrive with a job. Their employment rate is close to the ceiling because employment is the condition of their being here.
The countries lower down send more students, spouses and family members. Japan at 42.9% and China excluding ethnic Koreans at 39.0% are not weaker labour markets; they are populations with a different visa mix.
Vietnam at 55.2% sits in the middle for exactly that reason — Vietnam is both a large E-9 sending country and by far the largest source of international students, and the two pull the average in opposite directions.
So read this chart as a map of visa categories, not of nationalities. If you want to know your own prospects, the question is which status you hold — see which visas allow you to work.
By age
| 30s | 79.1% | ← the peak |
| 40s | 77.9% | |
| 50s | 70.2% | |
| 15–29 | 54.6% | |
| 60 and over | 43.7% | |
The 15–29 figure is low for the same reason Seoul's is low: that age band contains the students, and a study visa restricts working hours by law.
By education — the reversal
| Middle school only | 70.4% |
| University or college | 65.8% |
| High school | 65.4% |
| Primary school or less | 55.3% |
People whose education ended at middle school have the highest employment rate of any group — above university graduates. In a domestic labour market that result would be startling. Here it simply reflects that the E-9 route does not require higher education, while many degree holders are in Korea to study rather than to work.
Every one of these breakdowns points at the same thing. Residence status is doing the explaining, and nationality, age and education are standing in for it.
Employment insurance — the gap that costs money
One older table is worth the detour. In the 2022 survey, foreign wage earners answered whether they were enrolled in employment insurance:
Enrolled       63.5%
Not enrolled   28.9%
Don't know      7.5%

E-9 workers    80.9% enrolled
F-5 permanent  72.6% enrolled
E-1~E-7        72.3% enrolled
F-4            58.8% enrolled
H-2            49.9% enrolled — 39.6% not
Students       2.9% enrolled — 76.3% not
Two cautions before using these. They are 2022 figures, the most recent in this particular table, so treat them as the shape of the problem rather than today's level. And "don't know" was a permitted answer, which is itself informative: 7.5% overall, and 20.9% among students.
The practical consequence is direct. Employment insurance is what pays unemployment benefit when a job ends through no fault of yours. Roughly two in five H-2 holders answered that they were not enrolled. If you do not know your own status, your payslip will show the deduction — or show that it is missing.
What these numbers do not tell you
| Employment rate, not pay | this is who has a job, not what the job pays |
| Not causal | nationality does not cause an employment rate; the visa mix behind it does |
| 2025 data | except employment insurance, which is 2022 |
| Foreigners only | naturalised citizens are excluded throughout |
| Rounded | counts are published in thousands |
Read next
- What foreign workers actually earn — pay by visa
- Which visas allow you to work — the status that decides everything
- Unemployment benefit — what employment insurance buys you
- Your payslip and unpaid wages — checking your own deductions
Questions people ask
Why is the employment rate for my country low? Almost certainly because more people from your country are here on study or family visas than on work visas. It says little about individual prospects.
Does having a degree help me find work in Korea? This table cannot answer that. It shows that degree holders as a group have a slightly lower employment rate, because many of them are students. For an individual, the binding constraint is the visa.
How do I check whether I have employment insurance? Look at the deductions on your payslip. If the line is absent, ask your employer, then 1350.
Sources
Statistics Korea, KOSIS — foreigners only, excluding naturalised citizens
   DT_2FA003F  Economically active population by nationality (immigrants), 2025
   DT_2FA005F  Economically active population by age group (immigrants), 2025
   DT_2FA006F  Economically active population by education (immigrants), 2025
   DT_2FC019R  Wage earners by employment insurance enrolment (immigrants), 2022
   https://kosis.kr

Ministry of Employment and Labour: 1350 (interpretation available)